Data & Annotations
Reference documentation for the annotation data shipped with FAVOR. This page explains what is in the dataset, how annotation principal components are constructed, and where the underlying sources come from.
For numeric annotations marked (+), higher values indicate increased functionality. For (-), lower values indicate increased functionality. If you are looking for the upload workflow rather than the annotation catalog, start with Batch Annotation.
Bulk access
Variant set
The current FAVOR release contains 8,892,915,237 variants in total: all possible 8,812,917,339 SNVs plus 79,997,898 indels.
Gene-based annotation
Graphical illustration of gene-based annotation
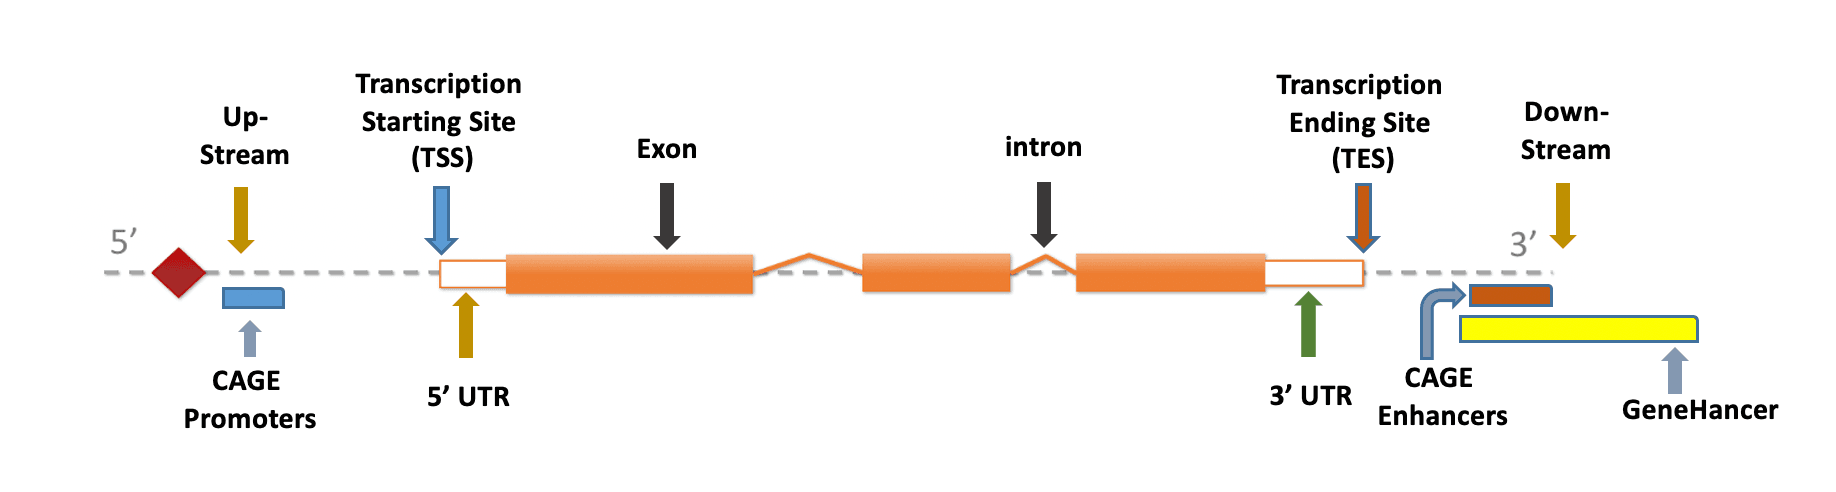
Exonic refers only to the coding exonic portion, not the UTR portion. UTR5 and UTR3 are reserved for UTR annotations. If a variant is in both 5' UTR and 3' UTR (for two different genes), "UTR5,UTR3" is printed.
Splicing is defined as a variant within 2bp of an exon/intron boundary. Upstream and downstream are defined as within 1kb of the transcription start site or transcription end site, respectively, taking the strand of the mRNA into account.
If a variant overlaps a CAGE promoter/enhancer or GeneHancer region, it will also be annotated accordingly.
Annotation principal components (aPCs)
It is often helpful to have a single metric summarizing multiple similar annotations measuring the same underlying biological function. Annotation PCs (aPCs) are principal component summaries of the multi-faceted functional annotation data in FAVOR. Unlike ancestral PCs that are subject-specific and calculated using genotypes across the genome, annotation PCs are variant-specific and calculated using functional annotations for individual variants. Different blocks of individual functional annotations are captured by different annotation PCs.
Currently aPCs are calculated for all PASS SNVs in the variant set.
| aPC | Derived from |
|---|---|
| aPC-Protein-Function | SIFT, PolyPhen-2, Grantham, Polyphen2 HDIV/HVAR, MutationTaster, MutationAssessor |
| aPC-Conservation | GerpN, GerpS, priPhCons, mamPhCons, verPhCons, priPhyloP, mamPhyloP, verPhyloP |
| aPC-Epigenetics-Active | H3K4me1, H3K4me2, H3K4me3, H3K9ac, H3K27ac, H4K20me1, H2AFZ |
| aPC-Epigenetics-Repressed | H3K9me3, H3K27me3 |
| aPC-Epigenetics-Transcription | H3K36me3, H3K79me2 |
| aPC-Local-Nucleotide-Diversity | bStatistic, RecombinationRate, NuclearDiversity |
| aPC-Mutation-Density | Common100bp, Rare100bp, Sngl100bp, Common1000bp, Rare1000bp, Sngl1000bp, Common10000bp, Rare10000bp, Sngl10000bp |
| aPC-Transcription-Factor | RemapOverlapTF, RemapOverlapCL |
| aPC-Mappability | umap_k100, bismap_k100, umap_k50, bismap_k50, umap_k36, bismap_k36, umap_k24, bismap_k24 |
| aPC-Proximity-to-Coding | Distance to nearest coding region |
| aPC-Proximity-to-TSS-TES | minDistTSS, minDistTSE |
| aPC-microRNA | microRNA target site annotation |
How aPCs are calculated
Step 0: Pre-processing
Variants with missing individual scores are imputed with their default values. Particular scores are transformed so that (1) a higher value always indicates increased functionality, and (2) the distribution becomes less skewed:
| SIFT* | = | 1 − SIFTval |
| minDistTSS* | = | −log(minDistTSS) |
| minDistTSE* | = | −log(minDistTSE) |
| Encodea* | = | log(Encodea) |
where a ∈ {H3K4me1, H3K4me2, H3K4me3, H3K9ac, H3K9me3, H3K27ac, H3K27me3, H3K36me3, H3K79me2, H4K20me1, H2AFZ}
Step 1: Grouping
Individual annotation scores are grouped into major functional blocks based on a priori knowledge. Each block captures a specific aspect of variant biological function: protein function, conservation, epigenetics, local nucleotide diversity, proximity to coding, mutation density, transcription factors, mappability, and proximity to TSS/TES.
Step 2: Standardization
For each annotation block k, all pre-processed individual scores within the block are centered and standardized to obtain the standardized annotation score matrix X̂k (each column has mean 0 and variance 1).
Step 3: First principal component
For each block k, the aPC raw score is the first PC from the standardized scores:
where ek,1 is the eigenvector corresponding to the largest eigenvalue of X̂kT X̂k. The sign is flipped if necessary so that aPC.rawk is positively correlated with the individual scores in that block.
Step 4: PHRED scaling
The raw scores are transformed into PHRED-scaled scores for each variant across the genome:
where M is the total number of variants across the whole genome. PHRED scores express rank in order of magnitude:
Annotation correlation structure
The heatmap below shows pairwise Pearson correlations between 145 individual and integrative functional annotations across 16 categories. Circle size and color encode correlation strength and direction: deeper red for positive and deeper blue for negative correlations.
Each annotation principal component (aPC) is the first PC calculated from standardized individual annotations that measure similar biological function, then PHRED-transformed for cross-variant comparability.
Figure 1. Correlation heatmap of individual and integrative functional annotations
Loading correlation data…
Pairwise Pearson correlations between 145 individual and integrative functional annotations across 16 categories, computed from a 0.06% SYSTEM sample (~5.5M of 8.9B variants). Collapsed blocks show the signed mean r across all member pairs (rendered as squares). New annotations since the original release include GPN-MSA, JARVIS, REMM, NCER, gnomAD Constraint, AlphaMissense, MACIE, CV2F, NCBoost, 28 dbNSFP predictors, and SpliceAI.
Full annotation catalog
Every variant in FAVOR carries annotations across the following categories. Fields marked NEW were added after the original FAVOR release.
Tissue and cell-type specific data
In addition to the per-variant annotations above, FAVOR provides tissue and cell-type specific datasets as separate downloadable parquet packs. These cover regulatory signals, QTL associations, enhancer-gene linkages, and chromatin state maps across hundreds of tissues and cell types.
| Category | Description |
|---|---|
| Tissue scores | Per-variant tissue-specific activity scores, ChromBPNet base-pair resolution predictions, allelic imbalance, allelic methylation, chromatin loops |
| eQTL | Expression QTLs, splicing QTLs, and APA QTLs with effect sizes, p-values, and tissue labels. Includes SuSiE fine-mapped credible sets |
| eQTL Catalogue | Unified eQTL associations across studies and tissues |
| Single-cell eQTL | Cell-type-specific eQTLs from DICE (immune) and PsychENCODE (brain) |
| Enhancer-gene linkages | Enhancer-gene links from ENCODE cCRE computational screens, ChIA-PET, CRISPR experiments, RE2G, EpiMap, and EpiRAction |
| Regulatory | Tissue-resolved chromatin accessibility peaks, cCRE tissue signals, ChromHMM states per biosample, validated enhancers |
| Polygenic scores | Polygenic score weights and metadata from PGS Catalog |
| Genotypes | Genotype matrices for regional analysis |
Data sources and versions
Annotations are drawn from the following sources, harmonized onto GRCh38 coordinates. This includes sources for both per-variant annotations and the tissue-specific data packs above. See the release notes for the history of source bumps and pipeline changes across releases.
| Source | Version | Data provided | Coverage |
|---|---|---|---|
| dbNSFP | v5.2 | 28 missense variant predictors | REVEL, BayesDel, ClinPred, MPC, ESM-1b, MetaRNN, PrimateAI, VEST4, and more |
| gnomAD | v4.1.1 | Allele frequencies, constraint scores | Genome + exome, 9 ancestry groups |
| ClinVar | 2025-04 | Clinical significance, disease associations | Reviewed pathogenic/benign classifications |
| dbSNP | b156 | rsID cross-references | All known variant identifiers |
| GENCODE | v47 | Gene annotations, consequence predictions | Comprehensive human gene set |
| RefSeq | r226 | Gene annotations, consequence predictions | NCBI curated transcript models |
| ENCODE cCREs | v4 | Candidate cis-regulatory elements, tissue signals | Enhancers, promoters, insulators, CTCF |
| SpliceAI | v1.3.1 | Splice-altering predictions | Donor/acceptor gain/loss probabilities |
| GTEx | eQTLs, sQTLs | Tissue-specific expression and splicing QTLs | |
| eQTL Catalogue | Unified eQTL associations | Cross-study, cross-tissue eQTL compendium | |
| DICE | Single-cell eQTLs | Immune cell type eQTLs | |
| PsychENCODE | Single-cell eQTLs | Brain cell type eQTLs | |
| EpiMap | Chromatin state annotations, enhancer-gene links | Epigenomic maps across biosamples | |
| EpiRAction | Enhancer-gene regulatory interactions | Tissue-specific regulatory links | |
| ENCODE RE2G | Enhancer-gene predictions | Regulation-to-gene linkages | |
| ChromBPNet | Base-pair resolution chromatin predictions | Tissue-specific variant effect predictions | |
| PGS Catalog | Polygenic score weights | Published polygenic scores and metadata | |
| ENCODE | Histone marks, DNase, RNA | 13 signals across 127 reference epigenomes | |
| COSMIC | Somatic mutations in cancer | Gene, transcript, protein change, sample count | |
| CADD | Combined Annotation Dependent Depletion | Integrative deleteriousness score | |
| AlphaMissense | Missense pathogenicity prediction | All possible missense substitutions | |
| GPN-MSA | Genomic Pre-trained Network scores | Genome-wide pathogenicity prediction | |
| BRAVO / TOPMed | Allele frequencies | 705M variants from 132K whole genomes | |
| 1000 Genomes | Global and population frequencies | 5 superpopulations | |
| PhastCons / PhyloP | Evolutionary conservation | Primate, mammalian, vertebrate clades | |
| ReMap | Transcription factor binding | TF and cell line overlap counts | |
| GeneHancer | Enhancer-gene links | Regulatory element to target gene scores |
Programmatic access